Building a Food Price Comparison App with Flask, SQLAlchemy, and Leaflet
I call my project “Trastr.” The name comes from the word “contrast,” and was coined at least 5 years ago when I was inspired to build a comparison site for electronics. Nothing ever came of that dream, but the domain I registered, trastr.io, was something I held on to.
By the summer of 2019, I had developed the skills to create a product comparison site, but was aware that many people were working on this problem in the electronics area (Wirecutter, America’s Test Kitchen, Consumer Report, ProductChart, etc.). Instead, I directed my focus towards the predicament of wildly changing grocery prices. I asked the question:
How is one to know where and when to purchase their groceries to maximize thrift?
There are a few proprietary software solutions to this problem, but I believe that the best way to economically gather fresh, global food price data is to employ volunteer contributors a la Wikimedia or OpenStreetMap. Armed with knowledge of Python and the Flask web framework from building the Egg Decoder, I began architecting a web app for the common man.
In Flask, the ‘views’ or ‘routes’ file is like the hallway in a house. Once launched, nearly all of the logic in the app starts here. Here is the most basic route in Trastr:
@app.route('/welcome')
def welcome():
    return render_template('welcome.html')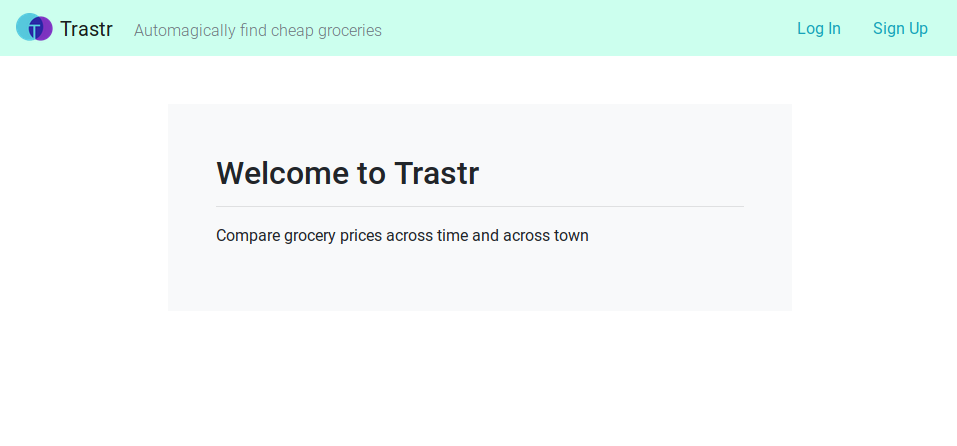
Upon visiting https://trastr.io/welcome, the user immediately receives ‘welcome.html,’ which is a quick explanation of the site. They also see ‘log in’ and ‘sign up’ buttons. In order to protect the integrity of data and defend against malicious visitors, I decided that an authentication system was in order. It uses a Flask extension called ‘flask-login’ to manage this, and Bcrypt for asymmetric key authentication. Here is the somewhat more complicated Flask route for logging a user in:
@app.route('/log_in', methods=['GET', 'POST'])
def log_in():
    #redirect user to the dashbord if they are already logged in
    if current_user.is_authenticated:
        return redirect(url_for('dashboard'))
    #instantiate form object to be passed to template
    form = LogInForm()
    if form.validate_on_submit():
        #query for user with entered email
        user = Users.query.filter_by(email=form.email.data).first()
        #check password in form against password in database
        if user and bcrypt.check_password_hash(user.password, form.password.data):
            #log the user in
            login_user(user, remember=form.remember.data)
            next_page = request.args.get('next')
            return redirect(next_page) if next_page else redirect(url_for('dashboard'))
        else:
            flash('Login Unsuccessful', 'danger')
    return render_template('log_in.html', form=form)
Once a user is authenticated, the real work can begin. For early testers and adopters in an area, this involves adding stores, products, and numerous prices. All this data needs storage, so I opted to use SQLite (and eventually PostgreSQL) for my database, accessing it through SQLAlchemy. Here is the SQLAlchemy schema for my ‘Products’ table, featuring relationships with the ‘Categories,’ ‘Product_Changesets,’ and ‘Prices’ tables:
class Products(db.Model):
id = db.Column(db.Integer, primary_key=True)
barcode = db.Column(db.Unicode(80), nullable=False)
category_id = db.Column(db.ForeignKey('categories.id'), nullable=False)
#data_structure_id = db.Column(db.ForeignKey('product_data_structures.id'))
name = db.Column(db.Unicode(80))
#brand_id = db.Column(db.ForeignKey('product_brands.id'))
magnitude = db.Column(db.Float)
magnitude_unit_id = db.Column(db.ForeignKey('magnitude_units.id'))
local_image = db.Column(db.Unicode(80))
remote_image = db.Column(db.Unicode(80))
#relationships
product_changeset = db.relationship('Product_Changesets', backref='product')#rel Product_Changesets
price = db.relationship('Prices', backref='product')
def __init__(self, barcode, category_id, name, magnitude, magnitude_unit_id, local_image, remote_image):
self.barcode = barcode
self.category_id = category_id
self.name = name
self.magnitude = magnitude
self.magnitude_unit_id = magnitude_unit_id
self.local_image = local_image
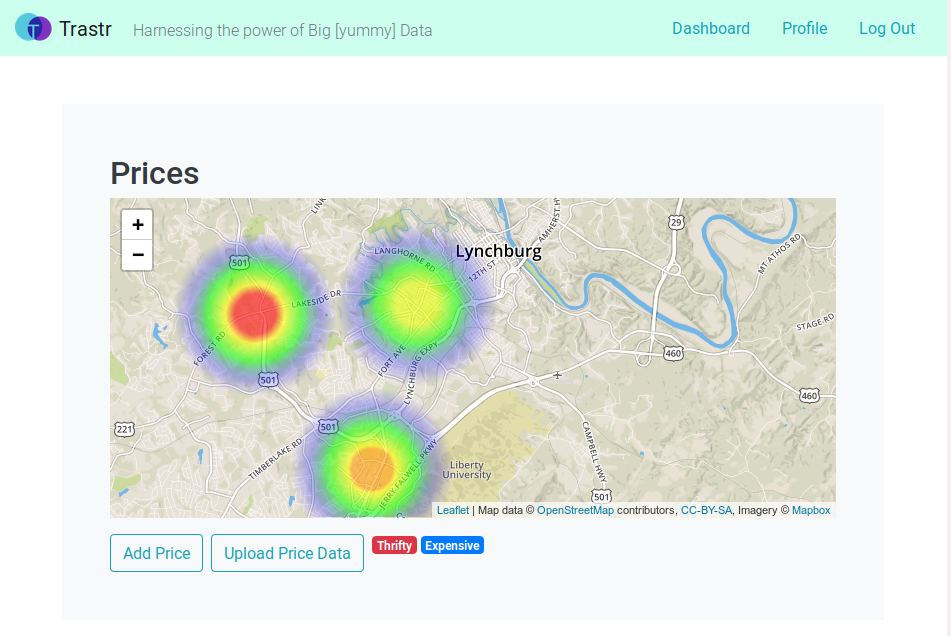
self.remote_image = remote_imageAll this charitable contribution to the community database is quite nice, but fruitless without readouts and visuals to help people make informed purchasing decisions. This is where I made use of Leaflet, a slippy map JavaScript library with support for extensions. My idea was to present a heatmap, indicating with blazing red that prices are low, and with muted greens and blues that prices are unremarkable. To display these colors, I interfaced with a library called heatmap.js. Here are snippets of several components that work together to create this heatmap:
#views.py

#This python snippet takes data which has already been queried from the database and organized in a nested dictionary, and calculates the average product value for each store in the database. The point is to assign a 'price score' which indicates how inexpensive it is to shop at a market. The data is later passed to the 'dashboard.html' template, which renders the heatmap

...
#iterate through intermediate organized data structure and calculate store value averages
    for store_id, store_data in heatmap_processed.items():
        store_sum = 0
        cat_count = 0
        for cat_id, cat_data in store_data.items():
            cat_sum = 0
            prod_count = 0
            for prod_id, prod_data in cat_data.items():
                cat_sum += prod_data
                prod_count += 1
            cat_avg = cat_sum/prod_count
            store_sum += cat_avg
            cat_count += 1
        store_avg = store_sum/cat_count
        price_score = 100-store_avg # TODO: build more dynamic thrift calculator
        store_location_query = db.session.query(Stores).filter_by(id = store_id).first()

        heatmap_store_data.append({'lat':store_location_query.lat,
            'lon':store_location_query.lon,
            'count':price_score})
...
//dashboard.html
//This JavaScript tidbit creates the map and heat layer that is displayed to the user. It receives data via Jinja variable insertion, and transcribes it to a Javascript dictionary
...
var mymap = L.map('mapid').setView([, ], 13);
L.tileLayer('https://api.tiles.mapbox.com/v4/{id}/{z}/{x}/{y}.png?access_token=', {
attribution: 'Map data © <a href="https://www.openstreetmap.org/">OpenStreetMap</a> contributors, <a href="https://creativecommons.org/licenses/by-sa/2.0/">CC-BY-SA</a>, Imagery © <a href="https://www.mapbox.com/">Mapbox</a>',
maxZoom: 18,
id: 'mapbox.streets',
accessToken: 'your.mapbox.access.token'
}).addTo(mymap);
var testData = {
max: 8,
data: [
//Transfer data from Python to JavaScript
// TODO: find out if extraneous comma after last point will cause issues in any browsers
]
};
...
All in all this project is a CRUD site with big aspirations. In the coming months, I intend to add several features:
- Price predictions through machine learning
- Histograms and other useful visualizations
- A food category taxonomy based on OpenFoodFacts
- An API for mobile app access
- Webcam barcode reading in the ‘Add Product’ form
To keep up with development or contribute to the project, visit its home at https://github.com/partytax/osm-landsat
